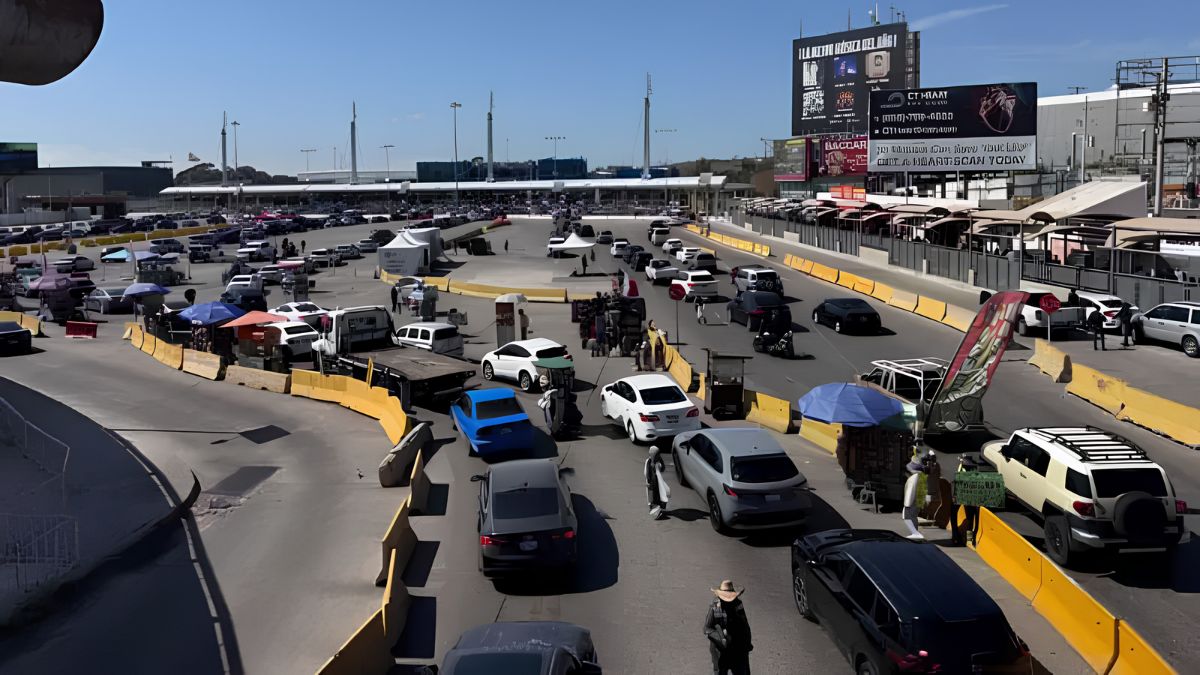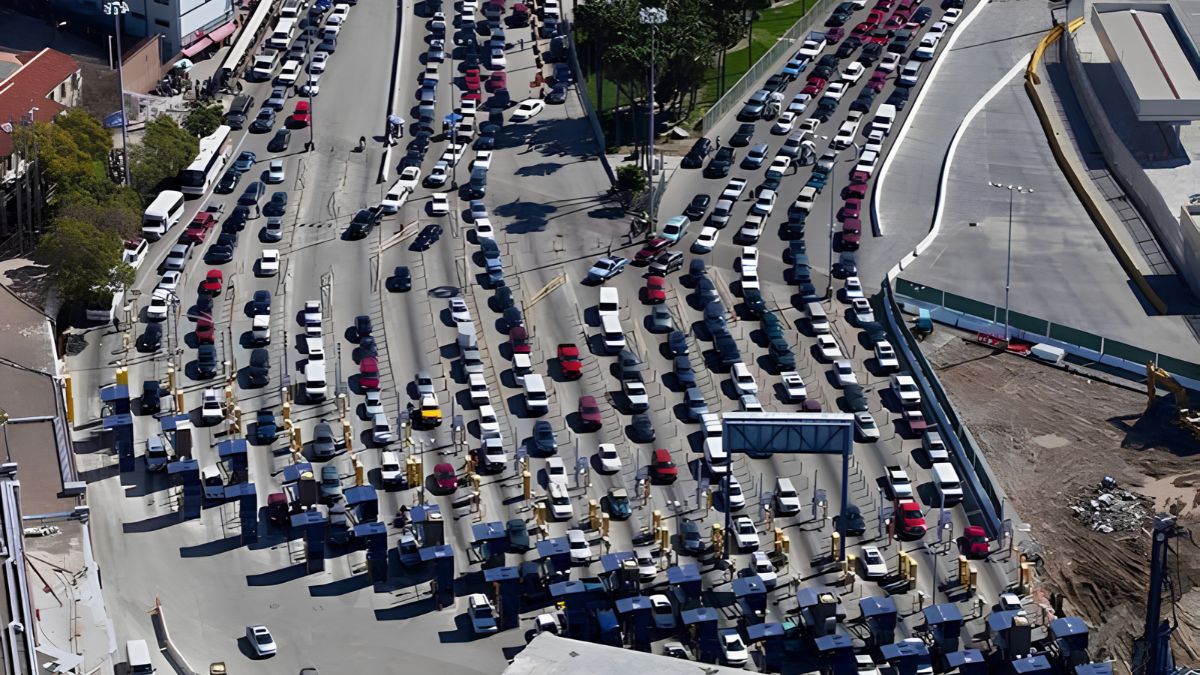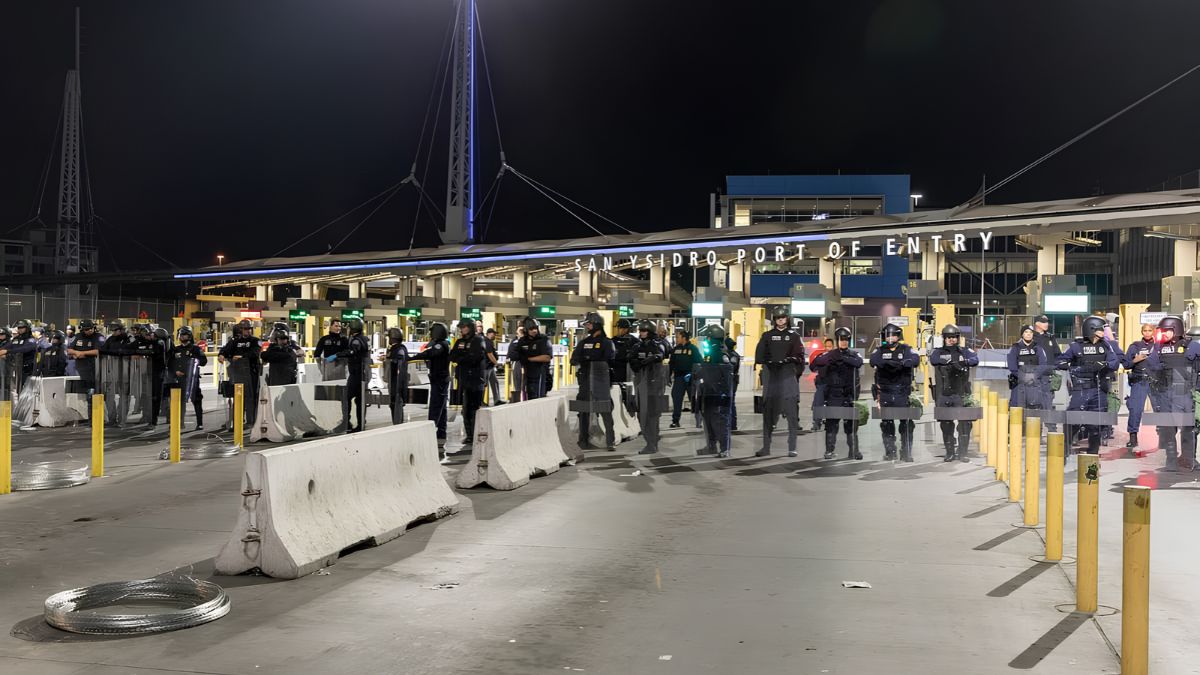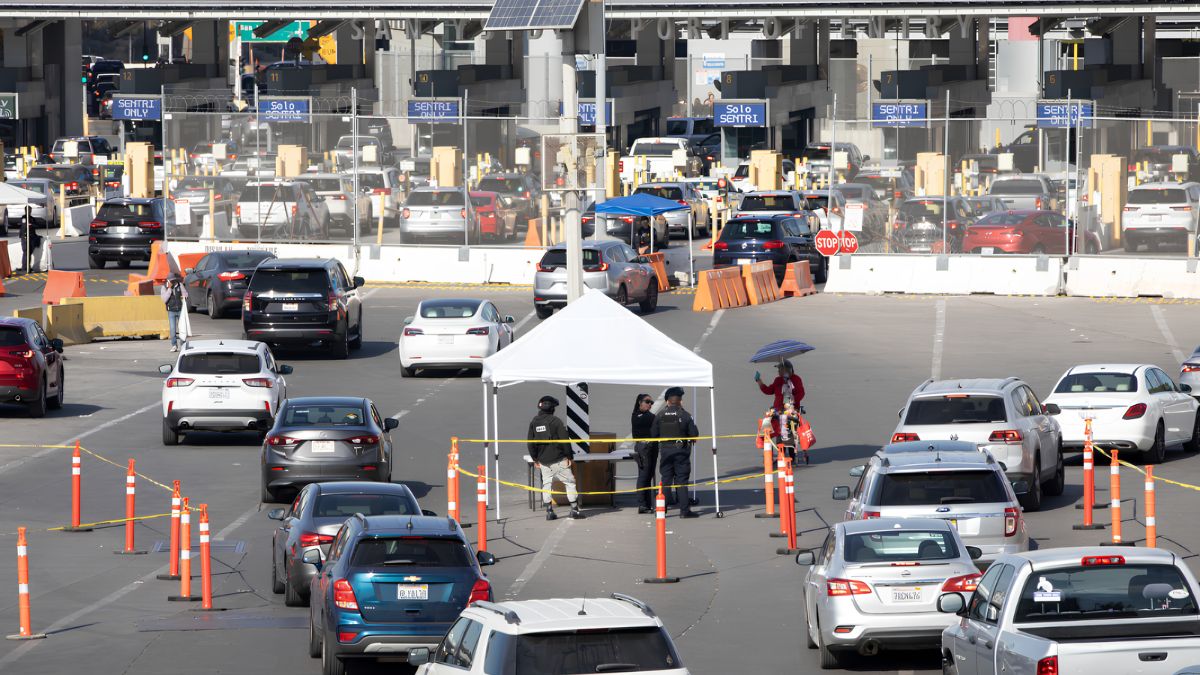
San Ysidro’s commercial corridors tell a story of changing transportation routes, neighborhood development, cross-border movement, and shifting business needs. Streets that now accommodate shops, restaurants, service businesses, and busy traffic may once have looked very different. To know how these commercial areas evolved, researchers can compare historical maps with archived aerial photographs, property records, city planning documents, and local historical accounts.
This approach is useful for residents, students, business owners, urban planners, and anyone interested in how San Ysidro developed over time. Historical maps show how roads, property boundaries, and settlement patterns changed, while aerial photographs reveal what was physically present on the ground. Together, these sources can help explain when commercial buildings appeared, how streets expanded, and where residential or undeveloped land gradually gave way to business activity.
The process does require care. A photograph may show that a building existed by a particular date, but it may not identify the business operating inside it. Similarly, a map can document a street or subdivision without proving that commercial activity began immediately. Reliable research combines several sources rather than relying on a single image or document.
Boundaries
Before researching commercial growth, define the corridor or corridors you want to study. San Ysidro is part of the City of San Diego, close to the U.S.-Mexico international border, and its commercial geography is closely connected to major roads, border access, and surrounding neighborhoods.
A useful study might focus on San Ysidro Boulevard, Beyer Boulevard, or commercial properties around the San Ysidro Port of Entry. These areas have different relationships with traffic, nearby housing, public infrastructure, and cross-border commerce. Studying them separately can reveal differences that might disappear in a broad overview of the entire community.
Start by selecting a manageable study area. You could examine a few blocks along one street, a major intersection, or a commercial district bounded by recognizable roads. Record the boundaries on a current map and keep them consistent when reviewing older materials.
Also establish a period of interest. A study covering the mid-20th century to the present may reveal changes in road layouts, building footprints, and land use. An earlier starting date may be appropriate if your research concerns the historical development of the settlement and its connection to the border.
Write down a few questions before collecting sources:
- When did the main commercial streets take their present form?
- Which properties changed from residential or undeveloped land to commercial use?
- How did road improvements affect access to shops and services?
- Did new parking areas, buildings, or intersections alter the corridor?
- Which parts of the commercial district remained relatively stable?
These questions will guide the research and help prevent the project from becoming an unstructured collection of old photographs.
Maps
Historical maps provide a framework for understanding how San Ysidro’s streets and land divisions changed. Depending on their date and purpose, maps may show road alignments, subdivisions, property boundaries, transportation links, public facilities, or named commercial areas.
One valuable starting point is the USGS topoView collection, which provides access to historical topographic maps of the United States. Researchers can look for maps covering San Ysidro and compare editions from different years. These maps are particularly helpful for identifying changes in road networks, developed areas, and surrounding terrain.
The Library of Congress Maps collection is another resource for historical cartographic material. Its holdings include maps of different periods and purposes, although coverage for a specific San Ysidro street or property will vary.
When examining each map, record its title, publication date, scale, creator, and source. Scale matters because a regional map may show the broad pattern of settlement but omit individual buildings. A detailed subdivision map may reveal property divisions without showing whether each lot was occupied.
Do not assume that a line or label represents a feature that existed exactly as depicted on the publication date. Some maps reproduce older surveys, show proposed developments, or contain generalized information. Check the map’s notes and legend before drawing conclusions.
Photographs
Archived aerial photographs offer a different view. Unlike many maps, they can show actual building footprints, parking lots, vacant parcels, road widths, vegetation, and other physical features visible at the time of photography.
The USGS EarthExplorer portal is an important place to investigate aerial imagery and related geospatial datasets. Available imagery depends on the location, collection, date range, and search settings. Researchers should check the metadata to establish when an image was captured and what type of imagery it contains.
Other potential sources include local historical archives, government planning records, university collections, and commercial historical imagery services. The San Diego History Center is a useful regional starting point for looking into historical photographs, archival collections, and material related to the development of San Diego communities.
Not every archive provides downloadable aerial photographs, and some collections require an in-person visit or a formal request. Search by geographic names as well as by subject. Terms such as “San Ysidro,” “South San Diego,” “border crossing,” and the names of relevant streets may lead to different records.
Once you find an image, preserve its original citation and metadata. A screenshot from a website may be convenient for initial review, but the original image record is more useful for formal research because it can provide a date, collection name, image identifier, and geographic reference.
Comparison
The strongest evidence often comes from comparing several dates rather than examining a single historical image. A sequence of aerial photographs can reveal gradual changes that are difficult to identify from memory or written descriptions.
For example, an early image might show a relatively open parcel near a main road. A later image could show a building on the same site, while a more recent photograph reveals an expanded structure and a paved parking area. This sequence supports a conclusion that the property’s physical development occurred between the image dates, although additional records are needed to determine the precise construction date and the business that occupied it.
A comparison table keeps observations organized:
| Date or period | Features to record | Possible significance |
|---|---|---|
| Earliest available image | Roads, open land, building footprints | Establishes an initial physical baseline |
| Intermediate image | New structures, subdivision changes | Indicates development during the interval |
| Later image | Parking, road changes, larger buildings | Shows changes in commercial form |
| Current imagery | Existing access and site layout | Helps relate historical evidence to the present |
Use the same study boundaries for every image. If the images have different scales or orientations, align them using stable reference points such as major intersections, long-standing road segments, or other identifiable features.
Be cautious when comparing images taken at different times of year. Tree cover, shadows, construction activity, and image resolution can make a building appear larger, smaller, or less distinct than it really is. Apparent differences should be checked against other images or maps wherever possible.
Timeline
After comparing maps and photographs, build a chronological timeline of the corridor. This transforms individual observations into a narrative of physical change.
Each entry should distinguish between what the source directly shows and what the researcher infers. For instance, if a 1960s photograph shows a new building footprint that is absent from an earlier image, you can reasonably state that the structure appeared between those two observation dates. You cannot automatically conclude that it opened as a shop in the same year.
A useful timeline might include:
- Road development: Changes to street alignments, intersections, and access routes.
- Parcel development: Subdivisions, lot consolidation, and changes in property layout.
- Building construction: New structures, additions, demolitions, and replacements.
- Commercial activity: Businesses documented through directories, permits, advertisements, or other records.
- Public infrastructure: Changes to sidewalks, transit facilities, drainage, and parking.
- Border-related development: Physical changes near the port of entry and roads serving cross-border traffic.
To establish the commercial history of a particular building, combine aerial imagery with city directories, historic newspaper advertisements, building permits, and planning documents where available. These sources may help identify when a property was built, what type of business used it, and whether its function changed over time.
Keep the timeline open to uncertainty. If the evidence only establishes that a structure existed by 1975, record “present by 1975” rather than assigning it an unsupported construction date. That small distinction makes the final research more credible.
Landuse
Aerial photographs can help researchers understand how land use changed across an entire corridor, not just at individual addresses. They can reveal whether development occurred as scattered buildings, continuous storefronts, large commercial sites, or mixed residential and business areas.
To make the analysis systematic, classify visible land use into a small set of categories. These might include commercial buildings, residential structures, vacant or undeveloped parcels, parking areas, transportation infrastructure, and public facilities.
Apply the same categories to each study date. If you change the classification system halfway through the project, apparent changes may reflect different definitions rather than real development.
A basic comparison could track the number of visible buildings, the approximate area occupied by structures, the amount of land used for parking, and the extent of continuous commercial frontage. These measures can be useful, but their limitations should be stated. Older photographs may not have enough resolution to distinguish small buildings, and visible building footprints do not reveal how many businesses operated inside them.
Researchers should also avoid treating every vacant parcel as land awaiting development. A site may have been used for storage, access, landscaping, or another purpose that is not obvious from an aerial image. Property records and written sources can help clarify these cases.
Records
Historical maps and aerial photographs show physical change, but they rarely explain all the reasons behind it. To understand why a commercial corridor developed in a particular way, consult records that document planning decisions, property transactions, construction, and business activity.
The City of San Diego’s official website is a starting point for locating planning information, community plans, municipal records, and other city resources. Researchers can investigate whether relevant planning documents, development approvals, or historical records are available for the chosen corridor.
Depending on the property and period, additional sources may include:
- Building and demolition permits.
- Zoning maps and community plan documents.
- Historic business directories and telephone books.
- Newspaper advertisements and local reporting.
- Property assessor records and parcel maps.
- Transportation and public works documents.
- Oral histories from long-time residents and business owners.
Access and retention vary by record type. Some older documents may be held by an archive rather than in an online database. Others may require a public records request or a visit to the appropriate office.
Oral histories can add important context, especially when residents remember when a shop opened, how people traveled to the area, or how a street changed after a road improvement. However, memories may differ about dates and events. Treat interviews as valuable evidence, and compare them with dated photographs or documents when possible.
Mapping
A geographic information system, or GIS, can bring historical evidence together in a single visual workspace. Researchers can place old maps and aerial images over a modern map, align them using recognizable reference points, and compare the locations of streets and buildings across time.
You do not necessarily need advanced software to begin. A spreadsheet, annotated images, and a consistent set of reference points can support a small research project. For more detailed work, GIS tools can help measure distances, compare land areas, and produce maps showing development at selected dates.
Georeferencing is the process of aligning an old map or image with real-world coordinates. It can be challenging when older maps are distorted, photographs were taken at an angle, or road alignments have changed. Always record the limitations of the alignment and avoid presenting approximate measurements as exact.
A final map series might include one map for each major period, with the same study boundary and a clear legend. A separate map could highlight sites where the available evidence indicates substantial physical change. Include the date and source for every image used.
Findings
The final research report should explain what changed, when the evidence shows it changed, and how confident you are in each conclusion. A clear distinction between observation and interpretation prevents the narrative from going beyond the available evidence.
For example, a report might establish that commercial building footprints became more extensive along a selected street between two dated aerial photographs. Planning documents could then help explain whether road improvements, subdivision decisions, or new development approvals contributed to the pattern. If the sources do not establish a cause, state that the relationship remains uncertain.
Avoid assuming that an increase in building area necessarily means more businesses, greater sales, or higher employment. A single large structure might replace several smaller properties, and an aerial photograph cannot establish whether a business was successful. Economic conclusions require additional evidence, such as business directories, employment records, or historical commercial data.
Cite each source directly in the report. For photographs, include the collection, image title or identifier, date, and archive. For maps, include the title, creator, publication date, and scale when available. Keep copies of relevant catalog records and note any access restrictions.
A careful study of San Ysidro’s commercial corridors can reveal more than the appearance of old streets and buildings. By combining historical maps, archived aerial photographs, planning records, and community memories, researchers can trace how commercial spaces developed and how the physical landscape changed around them.
The most useful findings come from consistent comparisons, clear citations, and conclusions that match the evidence. Starting with one street or a few blocks makes the project manageable and creates a foundation for a broader history of San Ysidro’s commercial development.
FAQs
Where can I find historical maps of San Ysidro?
Try USGS topoView and the Library of Congress Maps collection.
Where can I search for old aerial photographs?
Start with USGS EarthExplorer and regional historical archives.
What can aerial photographs reveal?
They can show building footprints, roads, parking areas, and land-use changes.
How can I date an old commercial building?
Compare imagery with permits, directories, property records, and planning documents.
Can old photographs prove when a business opened?
Not usually. Business directories and other dated records provide stronger evidence.